
To know what the consumer likes – eye-tracking makes it possible. Thanks to eye-tracking systems, marketing experts can make precise statements about the visual preferences of their target customers. Which products elicit the greatest interest? What details catch the eye? Is the viewers attention really directed at the product being advertised in TV commercials? Researchers at the University of Stuttgart Visualisation Research Centre (VISUS) are trying to develop innovative software products for the visualisation and analysis of highly complex eye-tracking data that should be able to answer these questions.
Eye-tracking systems use cameras, light sources and algorithms to trace eye movements. To this end, test subjects are equipped with eye-tracking glasses and, for example, positioned in front of a filled supermarket shelf. The spectacles track and record every movement of the eyes. The eye-tracking device projects an infrared light onto the retina of test subject. The reflection of this ray, which is invisible to the human eye, provides the system with information about the direction vector and spatial distance. Up to 60 data points are recorded per second. There are over ten known eye movements, which can be summarised in three categories: fixations (focusing the eye on a single point), saccades (eye movements between two fixations) and tracking (following a moving object with the eye). Algorithms convert the collated data into statements about the eye movements of the test subjects.
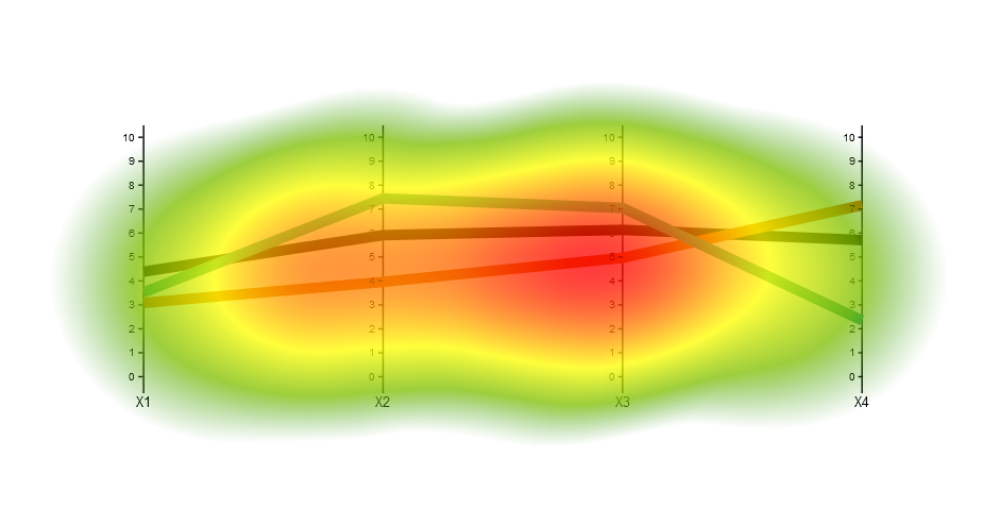
Analyzing such a wealth of data is a major challenge. The most common ways of coping with it in static images involves the use of so-called attention heat maps and gaze plots. Attention heat maps provide a visualization of the points on which eyes have been focused and use color coding to emphasize any regions that one or more test subjects have focused on more intensively. The warmer the color, the longer attention has been focused on the area
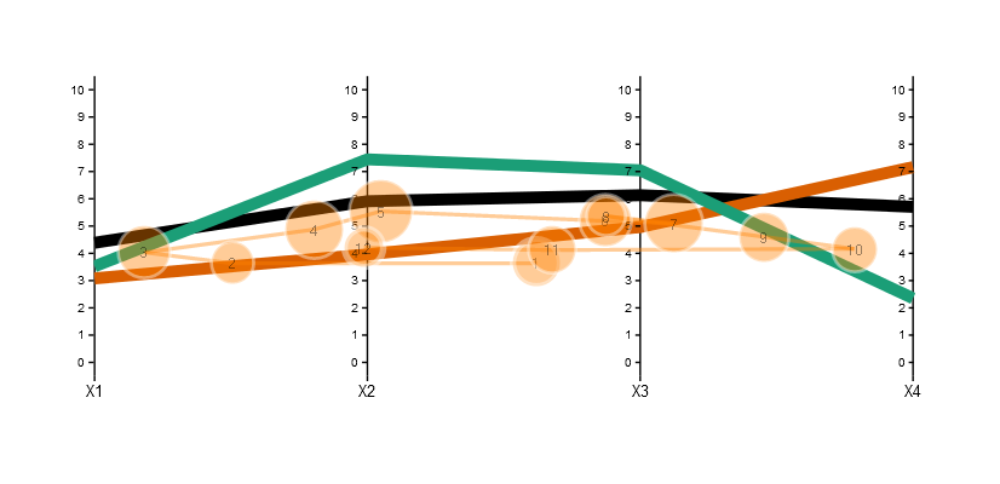
Gaze plots also make use of the paths traced by eye movements. Fixations are represented by dots, whose circumference increases in line with the attention duration, whilst saccades are represented by the connecting lines between points. As such, gaze plots measure both the intensity of focus as well as the chronological sequence of the eye movements. However, neither method is suitable for work using fi lm or other dynamic stimuli, because the complexity of the collated data exceeds the capacity of traditional 2D visualisation techniques.
Professor Weiskopf and his team from the VISUS are currently looking into ways of deciphering and visualizing complex spatial data of this type. The ISeeCube System, which was developed at the VISUS visualizes eye movements that occur when watching films and animated graphics.

The points of attention from all test subjects is projected onto the fi lm material in a three dimensional presentation . The provides an instant impression of which areas the test subjects have primarily focused on. In addition, a detailed analysis is enabled by a so-called scarf plot and the gaze stripes , whereby the data points from all test subjects are plotted along a timeline in the form of image sequences and are automatically grouped by attention patterns. This makes it possible to discover both individual differences between the test subjects as well as to defi ne areas of shared interest. Bianca Finkel